"Riemann-Zeta", by Randall Munroe, licensed under Creative Commons Attribution-NonCommercial 2.5 License
Alt Text
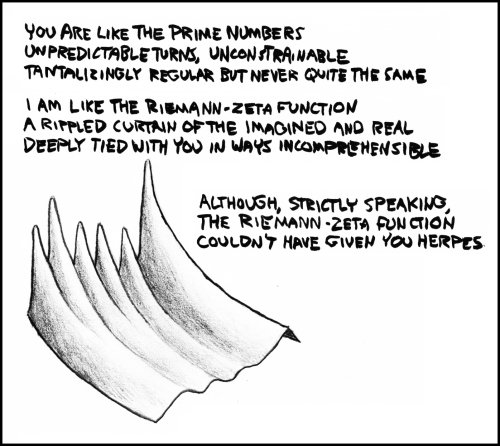
The graph is of the magnitude of the function with the real value between 0 and 2 and the imaginary between about 35 and 40. I've misplaced the exact parameters I used.